Use DWARF to debug WASM in the browser (part 3)
Convert the line number program to Source Maps
In the previous article we showed how you can use the information extracted from the debug section of you WASM binary to extract a correspondence matrix between source locations and instruction address. In the last article of the series, we are going to convert this data to a source map.
Source maps are the DWARF equivalence for the browser. Well, it is a pretty inaccurate statement but still useful to understand what source maps are. They are used by browsers to download original source files and match the current Javascript executed line with the original source code. We need this "in browser" because, even though browsers do no execute binary code (at least not before WASM), the Javascript code executed in browser rarely looks like the code you are editing. First, people are writing more and more Typescript and even if they write Javascript, it will often be the case that the written Javascript will be transpiled, minified, packaged (and sometime even uglyfied along the way) so that trying to debug it without source maps is next to impossible.
You will find here a pretty good introduction to source maps so you can get detailed knowledge of their format.The idea we are going to follow here is not mine but comes from the emscripten team which had the idea of converting DWARF line number programs to source maps. They wrote a little python script which parses the output of dwarfdump and generate a source map file. It's pretty neat and works well, however what we are doing is a little different. Instead of parsing the output of dwarfdump we are reading the DWARF symbol directly (what we've been doing for the last 3 articles!) and then, instead of generating a file that must be served separately we will embed the source maps directly in the WASM file. We will be able to do that on the fly, in the browser, instead of relying on a separate development process where the source map must be generated and hosted on the backend. All in all it is just simpler for the user and allow you to even debug WASM that comes from some third party sources, as long as it contains the DWARF symbol.
A source maps file can look like this:
{
  "version": 3,
  "names": [],
  "sources": [
    "../../../../snap/zig/5649/lib/std/builtin.zig",
    "main.zig"
  ],
  "sourcesContent": null,
  "mappings": "wEA8vBA,qCAqBgB,GADJ,MChxBZ,4CACW,OAAI,WAAF,sEAAA,OAAT,6BAAA"
}
This is, obviously, JSON. We will be using the latest version which is version 3. The names field contains strings to be used as references elsewhere, like .debug_str. Not used here. sources and sourcesContent are used to provide the actual source code you want to display in the debugger. There is no sourcesContent yet in DWARF 4 (maybe in DWARF 5?) but the filenames, as we saw, are available and are going to end up in the sources array. Finally the mappings array is where the correspondence are made between lines in the interpreted Javascript and the source. The entries look cryptic but here to, we have a little state machine, albeit a little simpler than the DWARF one, to encode this correspondence in a space saving manner.
Mappings
First the encoding used is VLQ which is exactly like LEB128 but for the endianess. On top of the VLQ encoding the representation is base64 because the web is based on text and having binary data in JSON usually means base64. Each entry in mappings is called a segment and contains:
- the column in the interpreted file,
- the index of the file in the sources field,
- the row in the source file corresponding to the aforementioned column and
- the column in the source file.
If we look at the first segment in the provided example: wEA8vBA, we can convert that to:
- wE -> 72
- A -> 0
- 8vB -> 766
- A -> 0
If you want an actual piece of code that convert the DWARF line number program to the source maps, have a look at my dwarf-to-sourcemap project (more on that later).
Source Maps in WASM
This is all well and good but once we generate the source maps text, how do we embed Source Maps in a WASM file exactly? Well the same way we embed DWARF symbols. We will create a custom section called "sourceMappingURL" and append the source map in the WASM directly has an "inline" source map. Indeed there are two ways for source maps to works. Either, the source maps is referenced as a URL like so:
//# sourceMappingURL=http://example.com/path/to/your/sourcemap.map
This is what you would find at the bottom of a Javascript file and would instruct the browser to fetch sourcemap.map and associate it with the current file. Or you could use an "inline" source map which is basically the whole source map file encoded as a base64 url like so:
//# sourceMappingURL=data:application/json;charset=utf-8;base64,eyJ2ZXJzaW9uIjozLCJmaWxlIjoi...0=
Here, no need for the browser to fetch the source map file, everything is in the base64 code. The advantage is that you do not need to serve the source map file which, in our case, would not have been possible because the file is generated on the frontend side, in the browser !
So once the source map is created, encode it in base64, append a custom section titled "sourceMappingURL" and lo and behold: debugging works !
That's it
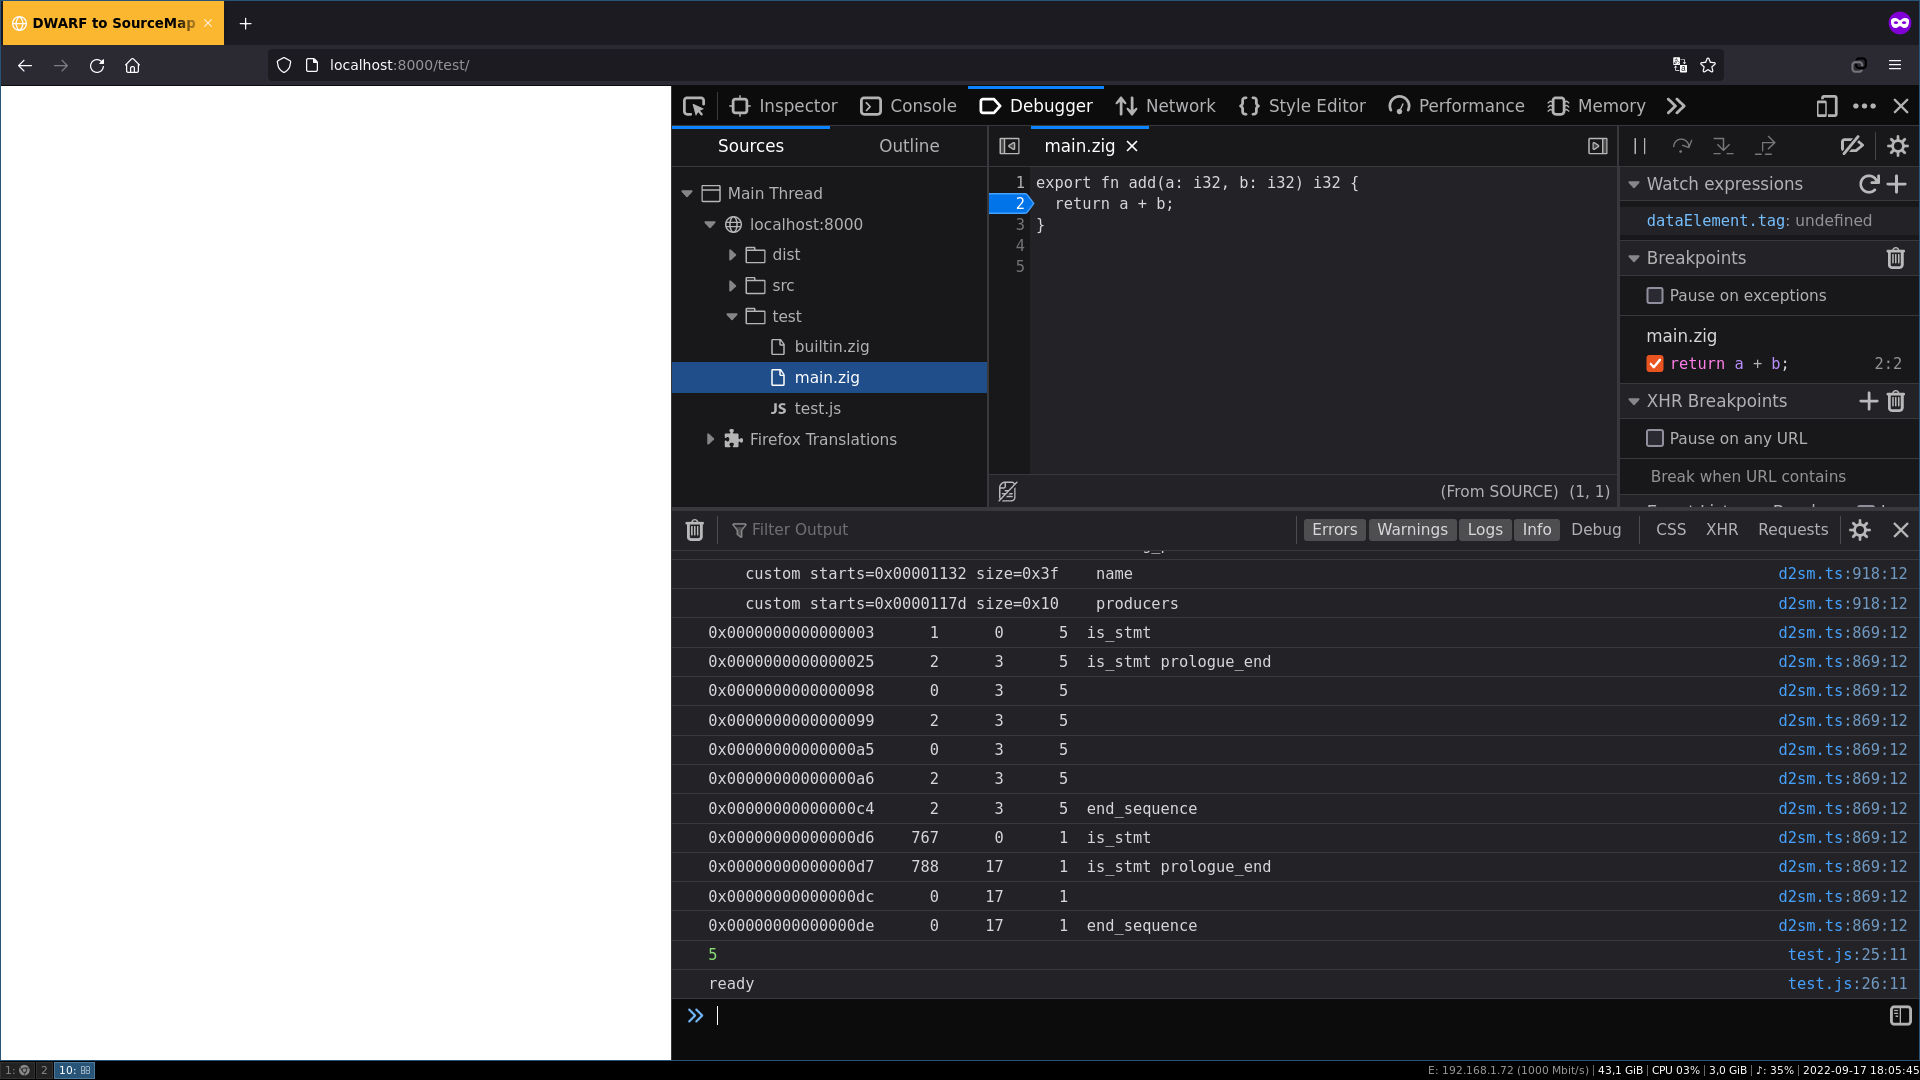
All this for this!
dwarf-2-sourcemap
In the process of writing these articles I wrote a tool that provides the exact service I was looking for when I had trouble with my little WASM program. As I already mentioned, nothing here is original, some pieces of code, here and there, were already doing the job but not the way I wanted to. You could generate the source map with a combination of dwarfdump and wasm-sourcemap.py and then use this to fix the URL generated so it matches the address of your server but that was a bunch of tools that, in the end, were not practical. Our solution can implemented in the browser and do its thing on the fly. It is written in Typescript in a readable way hopefully and can be used as a reference for understanding the various concept we talked about here.
Right now, dwarf-2-sourcemap only allow you to see the original code, set breakpoints and step over instruction but you can't hover over variables and only the raw WASM registers are visible and are not converted to the actual variable name. That could be the object of further improvement down the line. PR welcomed !